Why are VCs OBSESSED with Software??
by Harlem Capital

Marc Andreessen famously wrote, Why Software is Eating the World, almost exactly nine years ago. At the time, most had no idea what Marc was talking about. Even when we founded Harlem Capital (HCP), we wondered why so many of our venture conversations dropped the term “software.” We understood that software was powerful, but is a venture capitalist basically just a software investor??
Almost 5 years later, we finally understand why VCs are obsessed with software — because of the Revenue Multiples.
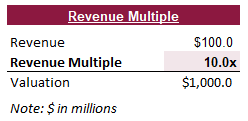
Revenue Multiple means the number of times someone values the business based on revenue. So a 10.0x revenue multiple implies that if there is $100mm of revenue then the business is worth $1bn, as shown in the example above. It should be noted that revenue in venture is typically referred to as ARR or Annual Revenue Run-rate. This is a fancy way of saying the latest month of revenue multiplied by 12. ARR and other venture terms are defined here.
So how are revenue multiples determined and why do they vary across industries? There are a variety of external reasons (market size, customer base, etc.) that we won’t get into, but one key financial reason is Gross Margins (Revenue — Cost of goods sold).
Gross Margins
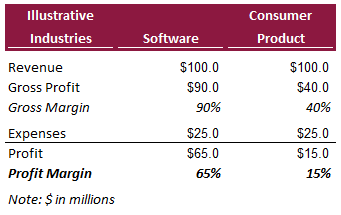
A true software business will typically have 90%+ gross margins. This is because there is little cost to provide software as it’s not a physical product. If we compare this to consumer products, which require materials and manufacturing leading to sub 50% margins often. There are exceptions like beauty products, which can be 70%+ margins, but most consumer products are not this high margin. So why does the difference in gross margins matter?
Generally speaking, higher gross margins lead to higher profit margins, aka CASH to investors. As much as VCs talk about revenue, public investors like to talk about profits. The higher the gross margins, the more cash available for investors. Let’s take the above example and assume the businesses each have $25mm of expenses. You can see the difference in profit margins of 15% for products versus 65% for software. Note that these illustrative examples are assuming a business is closer to maturity as early stage fast growing startups likely won’t be profitable. However, the multiples for a sector are often determined by these more mature businesses because a startup will either go public or get acquired by a larger company. This is why at HCP we always look at the public comparables and acquisitions to see the revenue multiples in the industry.
Revenue Multiples By Industry
We analyzed the top 10 industries that made it to further diligence at HCP and then pulled the revenue multiples from our memos to see the median ranges. Note there are ALWAYS outliers to revenue multiples ranges for industries, but these just represent the median ranges of public companies and transactions included in the industries of our internal analysis.
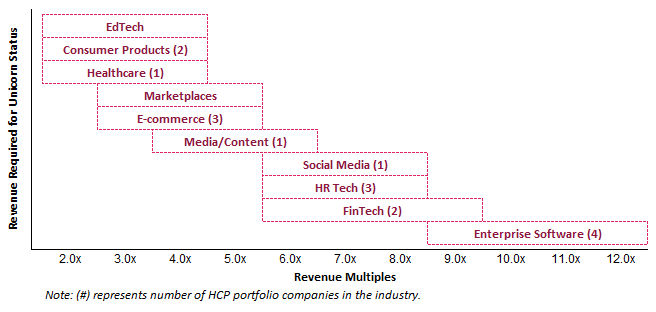
Harlem Capital Fund I has made 17 investments to date in 8 industries. The median public revenue multiple is 7.2x and the average revenue multiple is 8.0x. Although we are agnostic, we quickly realized that we favor industries with higher revenue multiples (5x+). The reason being, it requires less revenue to reach unicorn status ($1bn valuation).
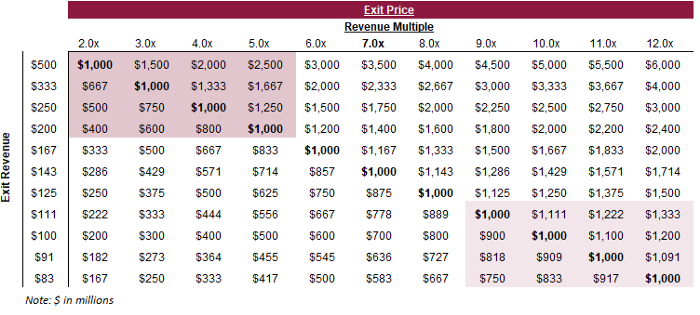
There are a lot of numbers in the above table, but it follows the pattern of the previous industry chart. The inside of the table is showing the exit price based on revenue and revenue multiple. The top left highlights industries like EdTech, Consumer Product, Marketplaces, etc. which need $200-$500mm of revenue to reach $1bn valuations given the 2–5x revenue multiples. This compared to the bottom right highlighting Enterprise Software, which only requires $83-$111mm of revenue to reach $1bn valuation given the 9–12x revenue multiples.
This doesn’t mean lower revenue multiple industries can’t reach unicorn status because plenty have. However, it does mean the investor has to believe the lower revenue multiple company will see significant revenue growth.
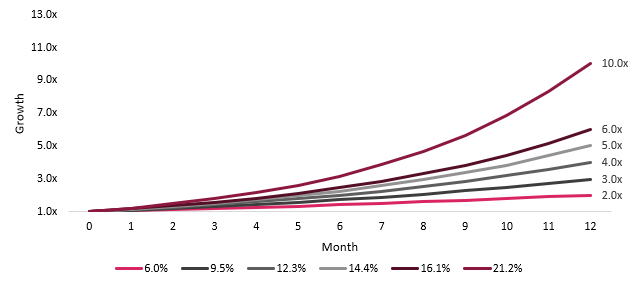
The growth rate of a business is not tied to any particular industry, but lower revenue multiple industries will need higher growth rates to reach the same valuations. HCP looks for companies that are growing 2–3x annually at a minimum, which implies 6.0%-9.5% month over month (m-o-m) growth based on the above graph. We have found most VCs to look for this minimum growth rate so founders should know there may be higher growth bars depending on the industry they are in.
Conclusion
In our previous post, we mentioned Seed valuations are typically determined by ownership targets, not traction or revenue multiples. So why does this matter for the Seed stage? It matters because Seed investors are picking companies for Series A investors who are picking for Series B investors and so on. Later stage investors and acquirors will do revenue multiple analysis, which will determine the Seed investor markup or exit price. Seed investors should make educated guesses to determine how future investors or acquirors will value the business, which implies the exit revenue required for a startup to return to the fund.
Founders should try to gauge who the public comparables or potential acquirors are because it can impact their funding and future returns. There may not be direct competitors or acquirors to gauge revenue multiples, but having something is always helpful. There are always exceptions, that is the nature of venture, but we recommend having 3–5 companies as comparables or acquirors to understand where you fit in the revenue model for VCs. Most VCs won’t ask you for this information, but a majority of startups will be pegged to an existing industry’s revenue multiples.
If you enjoyed this post then check out our previous post on returning the fund. To stay up to date on Harlem Capital, subscribe to our monthly newsletter.
Thanks to our Managing Partner, Henri Pierre-Jacques, for writing this piece.
Regards,
Harlem Capital Team
